

Contents of this article
In the previous article, we looked at the basic principle of technical analysis theory – markets move in trends. Naturally, the prices of the securities we follow are the concrete expression of those trends. To reinforce the view of price trends, technical analysts also make several other assumptions. In this article we will look at the six most important assumptions of a technical analyst.
First, technical analysts assume that prices are set by the interaction of supply and demand. According to basic economic theory, when demand rises, prices rise, and when demand falls, prices fall. One of the factors that determine supply and demand is the expectations of buyers and sellers. (You would not buy a stock unless you expected its price to rise.) Expectations are formed by human decisions, and those decisions are based on perceptions of information (whether correct or not), emotions (greed, fear, hope) and cognitive limitations such as behavioral biases, emotional biases and perceptions – factors rooted in the biochemical processes and electrical connections of the brain. A new field of research called neurofinance – an interdisciplinary study applying neuroscience to investing – is finding notable links between how the brain works, how people make decisions and how we invest.
Second, technical analysts assume that price discounts everything. Price reflects all information about an asset, including interpretations from the expectations formed on the basis of that information. This view was first put forward by Charles H. Dow, later re-emphasised by William Peter Hamilton in his editorials in the Wall Street Journal, and summed up concisely by Robert Rhea (1932), a prominent Dow theorist, writing about the stock market averages:
“The averages discount everything”: The fluctuations of the daily closing prices of the Dow-Jones rail and industrial averages reflect the combined hopes, disappointments and knowledge of everyone who participates. For this reason, future developments (excepting acts of God) are always properly anticipated in the price trend. The averages quickly appraise even calamities such as fires and earthquakes.
This statement sounds similar to Eugene Fama’s famous 1970 claim about the Efficient Markets Hypothesis (EMH) that “prices fully reflect all available information.” Fama, however, was mainly referring to specific information about the security, on the assumption that all information is interpreted instantly and rationally.
Although the assumptions of technical analysis include the concept that “price discounts everything”, as in the EMH, they go well beyond that simplicity. Technical analysis considers not only information about the security, but also external factors that may affect price, how that information is interpreted – which may be rational or not, direct or indirect – and the expectations formed through that interpretation. According to technical analysis, the interpretation of information can be driven by irrational exuberance, which can lead investors to overreact.
Professor Andrew Lo’s Adaptive Markets Hypothesis
To reconcile two current but opposing schools of finance – efficient markets and behavioral finance – Professor Andrew Lo (Charles E. and Susan T. Harris Professor at the MIT Sloan School of Management) proposed the Adaptive Markets Hypothesis in 2004. Lo built a theoretical framework based on the principles of evolution, competition, adaptation and natural selection, in which both markets and their participants change over time.

The relationship between risk and reward is not fixed; it changes with market conditions. Investors therefore do not try to optimise returns, because the cost of doing so is too high. Instead, they make investment decisions based on experience and “best guesses”, which leaves them vulnerable to interpretive and behavioral biases – namely, emotion.
As long as the market remains stable, these methods produce acceptable results. But when the economic environment changes and the old methods stop working, investors must adapt to survive. The size and strength of the different groups of interacting participants can change the environment. For example, when Russia defaulted on its government bonds in 1998, bondholders rushed to pull out liquidity, destabilising investors who held otherwise stable interest-rate positions and leaving them with losses and a shortage of liquidity. Those who adapted quickly survived; those who could not, failed. In short, investment strategies must change and evolve; innovation is the key to survival. And survival, not maximising the trade-off between risk and reward, is the ultimate goal.
Third, an important consequence of the assumption that markets trend is technical analysts’ belief that prices do not move randomly.
Fourth, technical analysis assumes that, in principle, history repeats itself (or, as Mark Twain is said to have put it, “History doesn’t repeat itself, but it often rhymes”), and that human behavior tends to repeat in circumstances similar to those of the past. This similar behavior tends to form patterns that lead to predictable outcomes. These patterns are almost never identical, so they must be interpreted – which leads to problems of inherent bias on the part of the technical analyst. This is one of the most controversial aspects of technical analysis, and also its oldest foundation. Yet only recently have these patterns been studied with modern statistical methods.
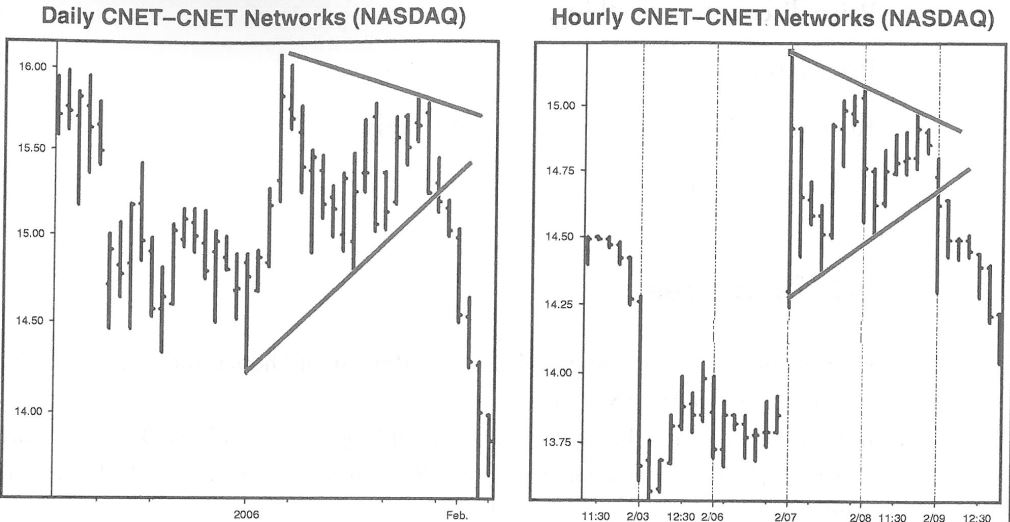
Fifth, technical analysts also believe that, like trends, price patterns are fractal. Every investor or trader has a specific timeframe of interest. Interestingly, whatever the timeframe, patterns have similar shapes and characteristics – although they are not exactly alike. An analyst looking at a 5-minute candlestick chart will therefore see patterns similar to those seen by an analyst looking at a monthly chart. These patterns show that the behavior that creates them is also influenced by the timeframe of interest of the market participants themselves.
For example, a pattern on a 5-minute chart is the result of the behavior of traders who all care about short-term price movement. Long-term investors have almost no effect on the 5-minute chart, just as short-term traders rarely affect the monthly chart. Each group of investors, distinguished by holding period, therefore has its own system of patterns. These systems may or may not influence one another, but they look alike in form. Pattern analysis is therefore a universal method that does not depend much on the timeframe.
Sixth, technical analysis also rests on the assumption that market sentiment is mutually reinforcing through an emotional feedback mechanism. For example, if an investor buys a stock and its price rises, they feel optimistic and tend to encourage others to buy too, pushing the price higher still. Market behavior is therefore not independent; it reflects how the market is moving and how participants influence one another. Excessive feedback can lead to an “asset price bubble”, where prices rise far above intrinsic value; conversely, a sharp decline can trigger widespread panic.
Technical analysis assumes that prices tend to overshoot equilibrium because of emotion, then revert to the mean, then overshoot the mean in the opposite direction — creating a continuous cycle of oscillations as investor psychology is amplified at each stage.
Technical Analysis Course – CMT Level 1
Green Chart designed this course specifically for candidates in Vietnam who want to study and prepare for the CMT Level I exam. The programme includes 28 sessions of theory, practice questions and mock exams. Students also receive the course materials, question bank and mock exams free of charge, and can retake the course for free for life.
See full course details here.