Contents of this article

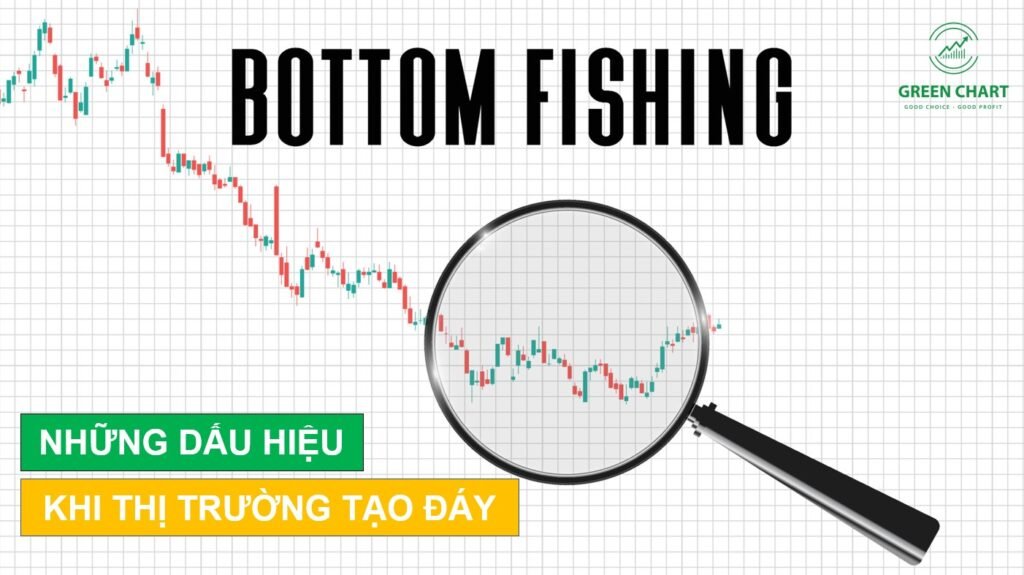
The best time for investors to consider accumulating stocks is when prices have bottomed and are preparing for a strong advance. So how do you identify that moment? The stock market does not move up and down at random; its rises and falls are signalled in advance. Investors with enough skill and experience to recognise the early signs can often anticipate when stocks are bottoming and when they are about to rise strongly.
Investors can anticipate a bottom using the signs listed below. By watching closely, they can seize golden opportunities that not everyone sees.
A flood of bad, negative news about the market and companies
Normally, when bad news is everywhere, stock prices fall sharply in reaction. But when bad news keeps coming and prices stop falling, it shows that there is no more panic supply left to dump. And with no supply pushing prices down, the market has stopped falling and is forming a bottom.
Trading volume dwindles and dries up
Although a stream of negative news is coming out, the decline in stock prices shows signs of slowing, and liquidity at that point is very thin – so thin it can hardly dry up any further.
Price action at this point shows a lack of supply to push prices lower. According to the law of supply and demand, exhausted supply means prices will stop falling. Investors simply wait for a clear signal that demand has appeared before starting to buy, because at that point demand has overwhelmed supply and the stock is preparing for a strong advance.

Positive divergence (convergence) on momentum indicators
This technical signal is very familiar to investors who like technical analysis.
We can use the MACD or RSI to check for divergence between the price trend and its momentum. The example below uses the MACD to identify a positive divergence.

As shown above, the MACD has formed a very clear divergence with price: price made a lower low, but the MACD made a much higher low. Combining this signal with other analysis improves the odds of success and helps investors analyse and make decisions with more confidence.
A bullish reversal pattern forms
Chart patterns such as the inverse head and shoulders and the double bottom are patterns that form at a stock’s bottom. Once such a pattern is complete, together with other price action factors, that is when price tends to rise strongly. So when investors recognise them, they can be more confident that the price will rise and place a buy order.

The Follow-Through Day (FTD)
This is one of the key signals from the overall market for confirming a bottom, according to William O’Neil in his world-famous book How to Make Money in Stocks.
A Follow-Through Day (FTD) appears four to seven trading sessions after a “rally attempt” – the day on which the market index makes a new low in the downtrend but closes higher by the end of the session (picture the session forming a bullish pin bar candle).
Put simply, a Follow-Through Day (FTD) is a session that confirms big money flowing strongly into the stock market to build on the earlier rebound sessions.

Note: a Follow-Through Day (FTD) is not a buy signal but a signal confirming that the market has bottomed. It only satisfies the necessary condition; investors need other analysis, such as chart patterns and divergence, as the sufficient condition for making accurate and effective investment decisions.
These are some of the signs that can help stock investors recognise when the market is bottoming. This article presents the most common and simplest methods. Technical analysis is a vast field, and investors with deep knowledge and plenty of “flying hours” of experience will have their own methods for identifying market bottoms.
Happy trading !
Technical Analysis Course – CMT Level 1
Green Chart designed this course specifically for candidates in Vietnam who want to study and prepare for the CMT Level I exam. The programme includes 27 sessions of theory, practice questions and mock exams. Students also receive the course materials, question bank and mock exams free of charge, and can retake the course for free for life.
See full course details here.