Contents of this article
- What is open interest?
- How is open interest calculated?
- Case 1. A new buyer meets a new seller
- Case 2. A new buyer meets an existing seller
- Case 3. An existing buyer meets a new seller
- Case 4. An existing buyer meets an existing seller
- What does open interest tell traders?
- Technical Analysis course – CMT Level 1
- The “Stock Trading For A Living” course
What is open interest?
Open interest (OI) is the total number of long/short positions currently outstanding in the market. It is often used in place of volume in the derivatives market (futures and options).
Whenever one trader opens a long position, another trader opens the matching short position, and vice versa. As a result, the total long positions in the market always equal the total short positions, and that number is called open interest.
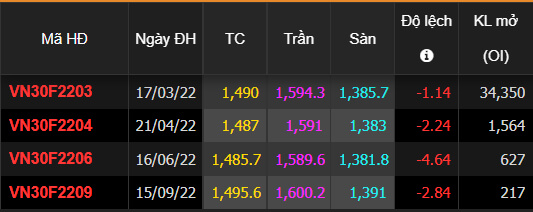
The open interest of a futures contract is published in market data; in Vietnam, you can easily find it on derivatives price boards.
How is open interest calculated?
Case 1. A new buyer meets a new seller
Let us start from the moment a VN30 index futures contract is first listed, when no trader holds a position yet. Suppose trader A places an order to buy 10 VN30 futures, and trader B places an order to sell 10 VN30 futures that matches A’s buy order. A now has a long position of 10 contracts and B has a short position of 10 contracts. The total on each side of the market is 10 contracts, so open interest is currently 10.
| Trader | Buy | Sell | Position |
| A (new) | +10 | +10 | |
| B (new) | -10 | -10 |
Case 2. A new buyer meets an existing seller
On day 2, a new trader C places an order to buy 6 contracts, matched by trader A’s order to sell 6 contracts. Investors’ positions in the market then change as follows:
| Trader | Buy | Sell | Position |
| A (existing) | +10 | -6 | +4 |
| B (existing) | -10 | -10 | |
| C (new) | +6 | +6 |
As you can see, open interest stays at 10 contracts, because trader C’s new positions are offset by existing investor A partly closing out.
Case 3. An existing buyer meets a new seller
On day 3, trader B places an order to buy 5 contracts, matched by a new trader D who places an order to sell 5 contracts. Because trader B already has a short position of 10 contracts, this 5-contract buy order closes 5 of those earlier shorts, reducing B’s position to -5.
Positions and open interest now change as follows:
| Trader | Buy | Sell | Position |
| A (existing) | +10 | -6 | +4 |
| B (existing) | +5 | -10 | -5 |
| C (existing) | +6 | +6 | |
| D (new) | -5 | -5 |
Case 4. An existing buyer meets an existing seller
By now you can work out the next case yourself: if existing trader B wants to buy 5 contracts and is matched with 5 contracts sold by trader C (also an existing trader), what happens? Open interest falls to 5, because both existing investors are reducing their positions.
| Trader | Buy | Sell | Position |
| A (existing) | +10 | -6 | +4 |
| B (existing) | +5 +5 | -10 | 0 |
| C (existing) | +6 | -5 | +1 |
| D (existing) | | -5 | -5 |
We have now seen how open interest rises and falls when trades take place between new traders, or between new traders and existing traders who already hold positions.
| Buyer | Seller | Change in OI |
| New | New | Increases |
| New | Existing | Unchanged |
| Existing | New | Unchanged |
| Existing | Existing | Decreases |
What does open interest tell traders?
Before making any forecasts, we first need to distinguish two concepts that are often confused: volume and open interest. Volume is the total number of units (shares, contracts) matched in a session or a specific trading period, and it is usually used to measure market liquidity. In the examples above, we can see that every match between a buyer and a seller adds to trading volume, but it may not increase open interest.
Watching changes in both volume and open interest together gives us a more objective and complete view of the current market trend. For example:
| Volume | Open interest (OI) | Interpretation |
| Rising | Rising | The current price trend is confirmed |
| Rising | Falling | Investor interest is waning. |
| Falling | Rising | The market is in an accumulation / distribution phase. |
| Falling | Falling | The current price trend is at risk of reversing. |
Keep in mind that open interest on its own only tells you about traders’ expectations and behaviour in the market; it has no predictive value for the next price trend.
Technical Analysis course – CMT Level 1
Green Chart designed this course specifically for candidates who want to study and prepare for the CMT Level I exam in Vietnam. The programme includes 25 sessions of theory, practice questions and mock exams. Students also receive free course materials, question banks and mock exams for their exam preparation, plus free lifetime retakes of the course.
Find out more about the course here.
The “Stock Trading For A Living” course
Green Chart designed this course to give you a solid grounding in fundamental analysis & stock valuation, and to show you how to integrate it effectively into your existing trading system, especially if you already trade with technical analysis. The programme includes 5 theory sessions and 6 months of hands-on trading guidance in the live market with the lecturer.
Find out more about the course here.
Other articles in the About the CMT designation section include:
CMT vs CFTe: comparing the two certifications.
What do CMT exam prep materials include?
How to create an account & register for the CMT Level 1 exam.